> ## Documentation Index
> Fetch the complete documentation index at: https://docs.hipocap.com/llms.txt
> Use this file to discover all available pages before exploring further.
# Viewing Traces
The trace view supports multiple ways to explore the same trace: Tree, Timeline, and Reader (via the View dropdown), plus Metadata and Ask AI (via dedicated buttons/toggles). In any view, selecting a span opens the full span detail pane on the right.
## Tree View
### Open Tree View
1. Open a trace (from **Traces**).
2. In the trace view toolbar, open the view mode dropdown.
3. Select **Tree** (you can switch back the same way).
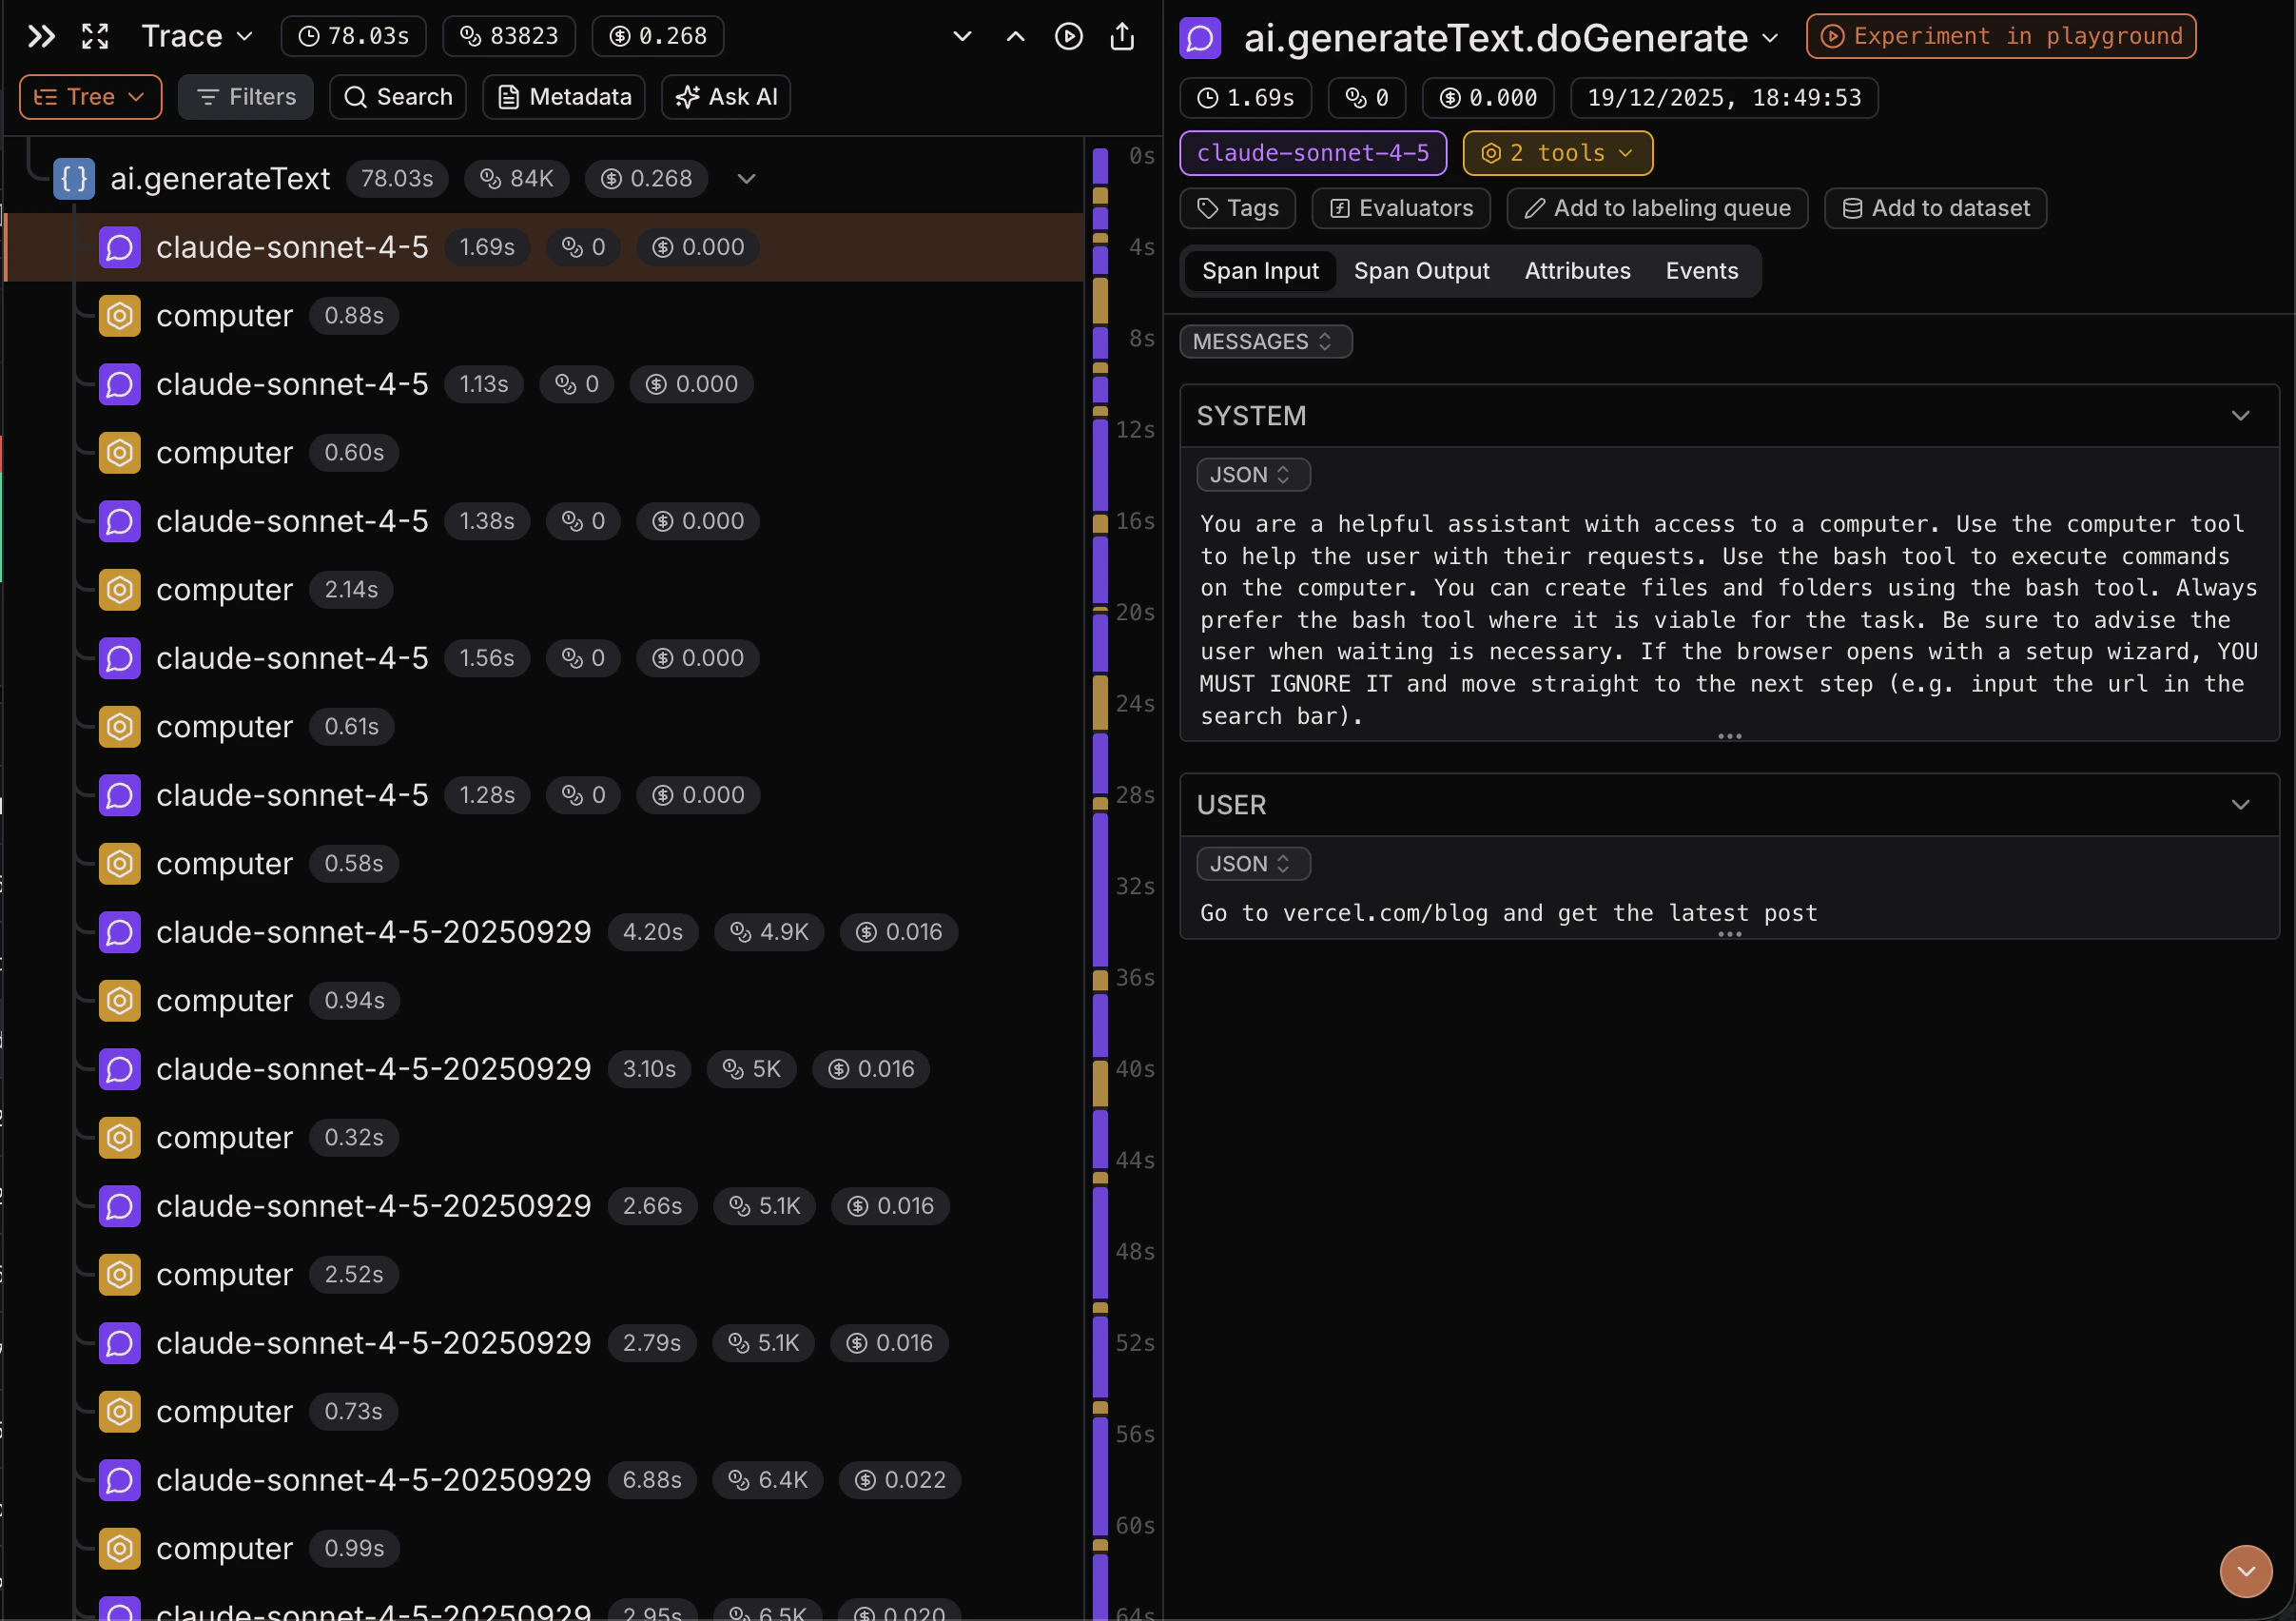 * **Hierarchy-first view**: Shows parent/child nesting so you can follow the trace’s call structure.
* **Collapsible branches**: Collapse spans with children to hide entire subtrees and reduce noise.
* **Inline metrics**: Duration on every row; tokens/cost badges on LLM spans.
* **Fast navigation**: Virtualized list stays responsive even on large traces.
* **Synced minimap**: Jump to spans quickly and scrub the shared session-time cursor.
Use Tree View when you want to understand structure: what called what, and where time/cost sits in the hierarchy.
## Reader Mode
Reader Mode gives you a readable, flattened view of a trace designed for fast scanning and review.
* **Hierarchy-first view**: Shows parent/child nesting so you can follow the trace’s call structure.
* **Collapsible branches**: Collapse spans with children to hide entire subtrees and reduce noise.
* **Inline metrics**: Duration on every row; tokens/cost badges on LLM spans.
* **Fast navigation**: Virtualized list stays responsive even on large traces.
* **Synced minimap**: Jump to spans quickly and scrub the shared session-time cursor.
Use Tree View when you want to understand structure: what called what, and where time/cost sits in the hierarchy.
## Reader Mode
Reader Mode gives you a readable, flattened view of a trace designed for fast scanning and review.
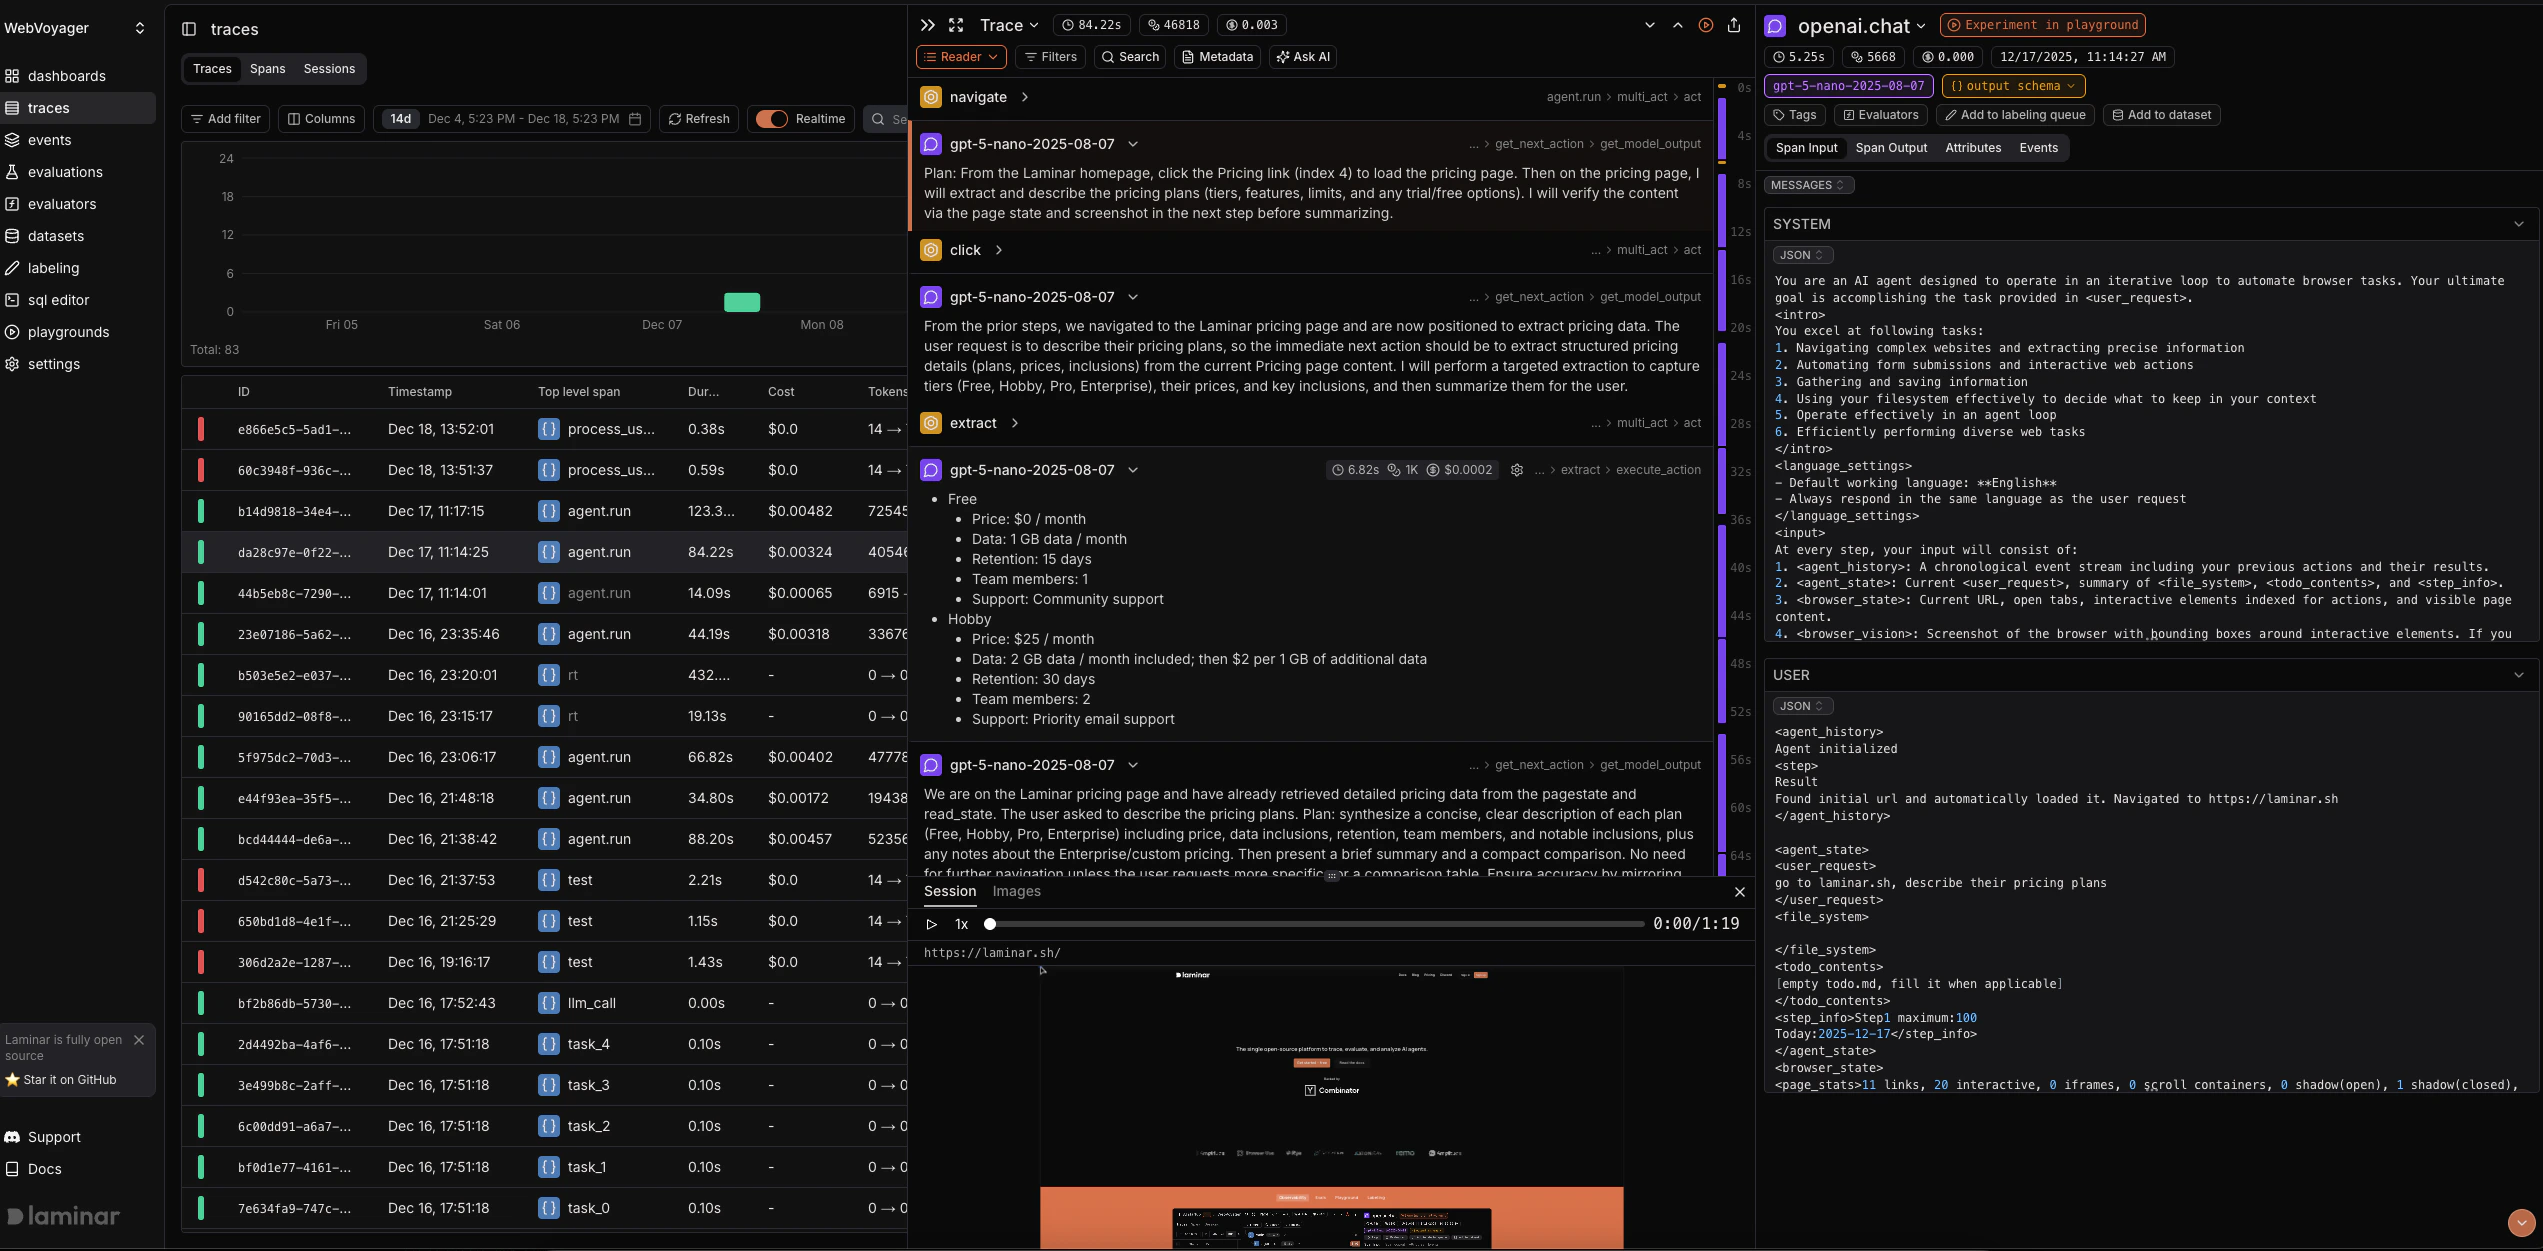 ### Open Reader Mode
1. Open a trace (from **Traces**).
2. In the trace view header, open the view mode dropdown.
3. Select **Reader Mode** (you can switch back the same way).
* **High-signal view**: Shows only LLM and tool-call spans by default (other spans hidden), making the trace much easier to parse.
* **At-a-glance columns**: Type/model, timing, tokens/cost, and breadcrumbs per row.
* **Expandable rows**: Open any row to see formatted outputs; selecting still opens the full span detail pane on the right.
* **Lazy-loaded outputs**: Fetches only what’s on screen to keep the UI fast.
* **Templates per path**: Apply saved Mustache templates per span path to reshape how outputs render.
* **Synced minimap**: Highlights spans in view and lets you jump or scrub session time.
Use Reader Mode when you want a narrative, high-signal view of a trace focused on LLM + tool calls, without drilling through nested spans.
## Timeline View
### Open Timeline View
1. Open a trace (from **Traces**).
2. In the trace view toolbar, open the view mode dropdown.
3. Select **Timeline** (you can switch back the same way).
### Open Reader Mode
1. Open a trace (from **Traces**).
2. In the trace view header, open the view mode dropdown.
3. Select **Reader Mode** (you can switch back the same way).
* **High-signal view**: Shows only LLM and tool-call spans by default (other spans hidden), making the trace much easier to parse.
* **At-a-glance columns**: Type/model, timing, tokens/cost, and breadcrumbs per row.
* **Expandable rows**: Open any row to see formatted outputs; selecting still opens the full span detail pane on the right.
* **Lazy-loaded outputs**: Fetches only what’s on screen to keep the UI fast.
* **Templates per path**: Apply saved Mustache templates per span path to reshape how outputs render.
* **Synced minimap**: Highlights spans in view and lets you jump or scrub session time.
Use Reader Mode when you want a narrative, high-signal view of a trace focused on LLM + tool calls, without drilling through nested spans.
## Timeline View
### Open Timeline View
1. Open a trace (from **Traces**).
2. In the trace view toolbar, open the view mode dropdown.
3. Select **Timeline** (you can switch back the same way).
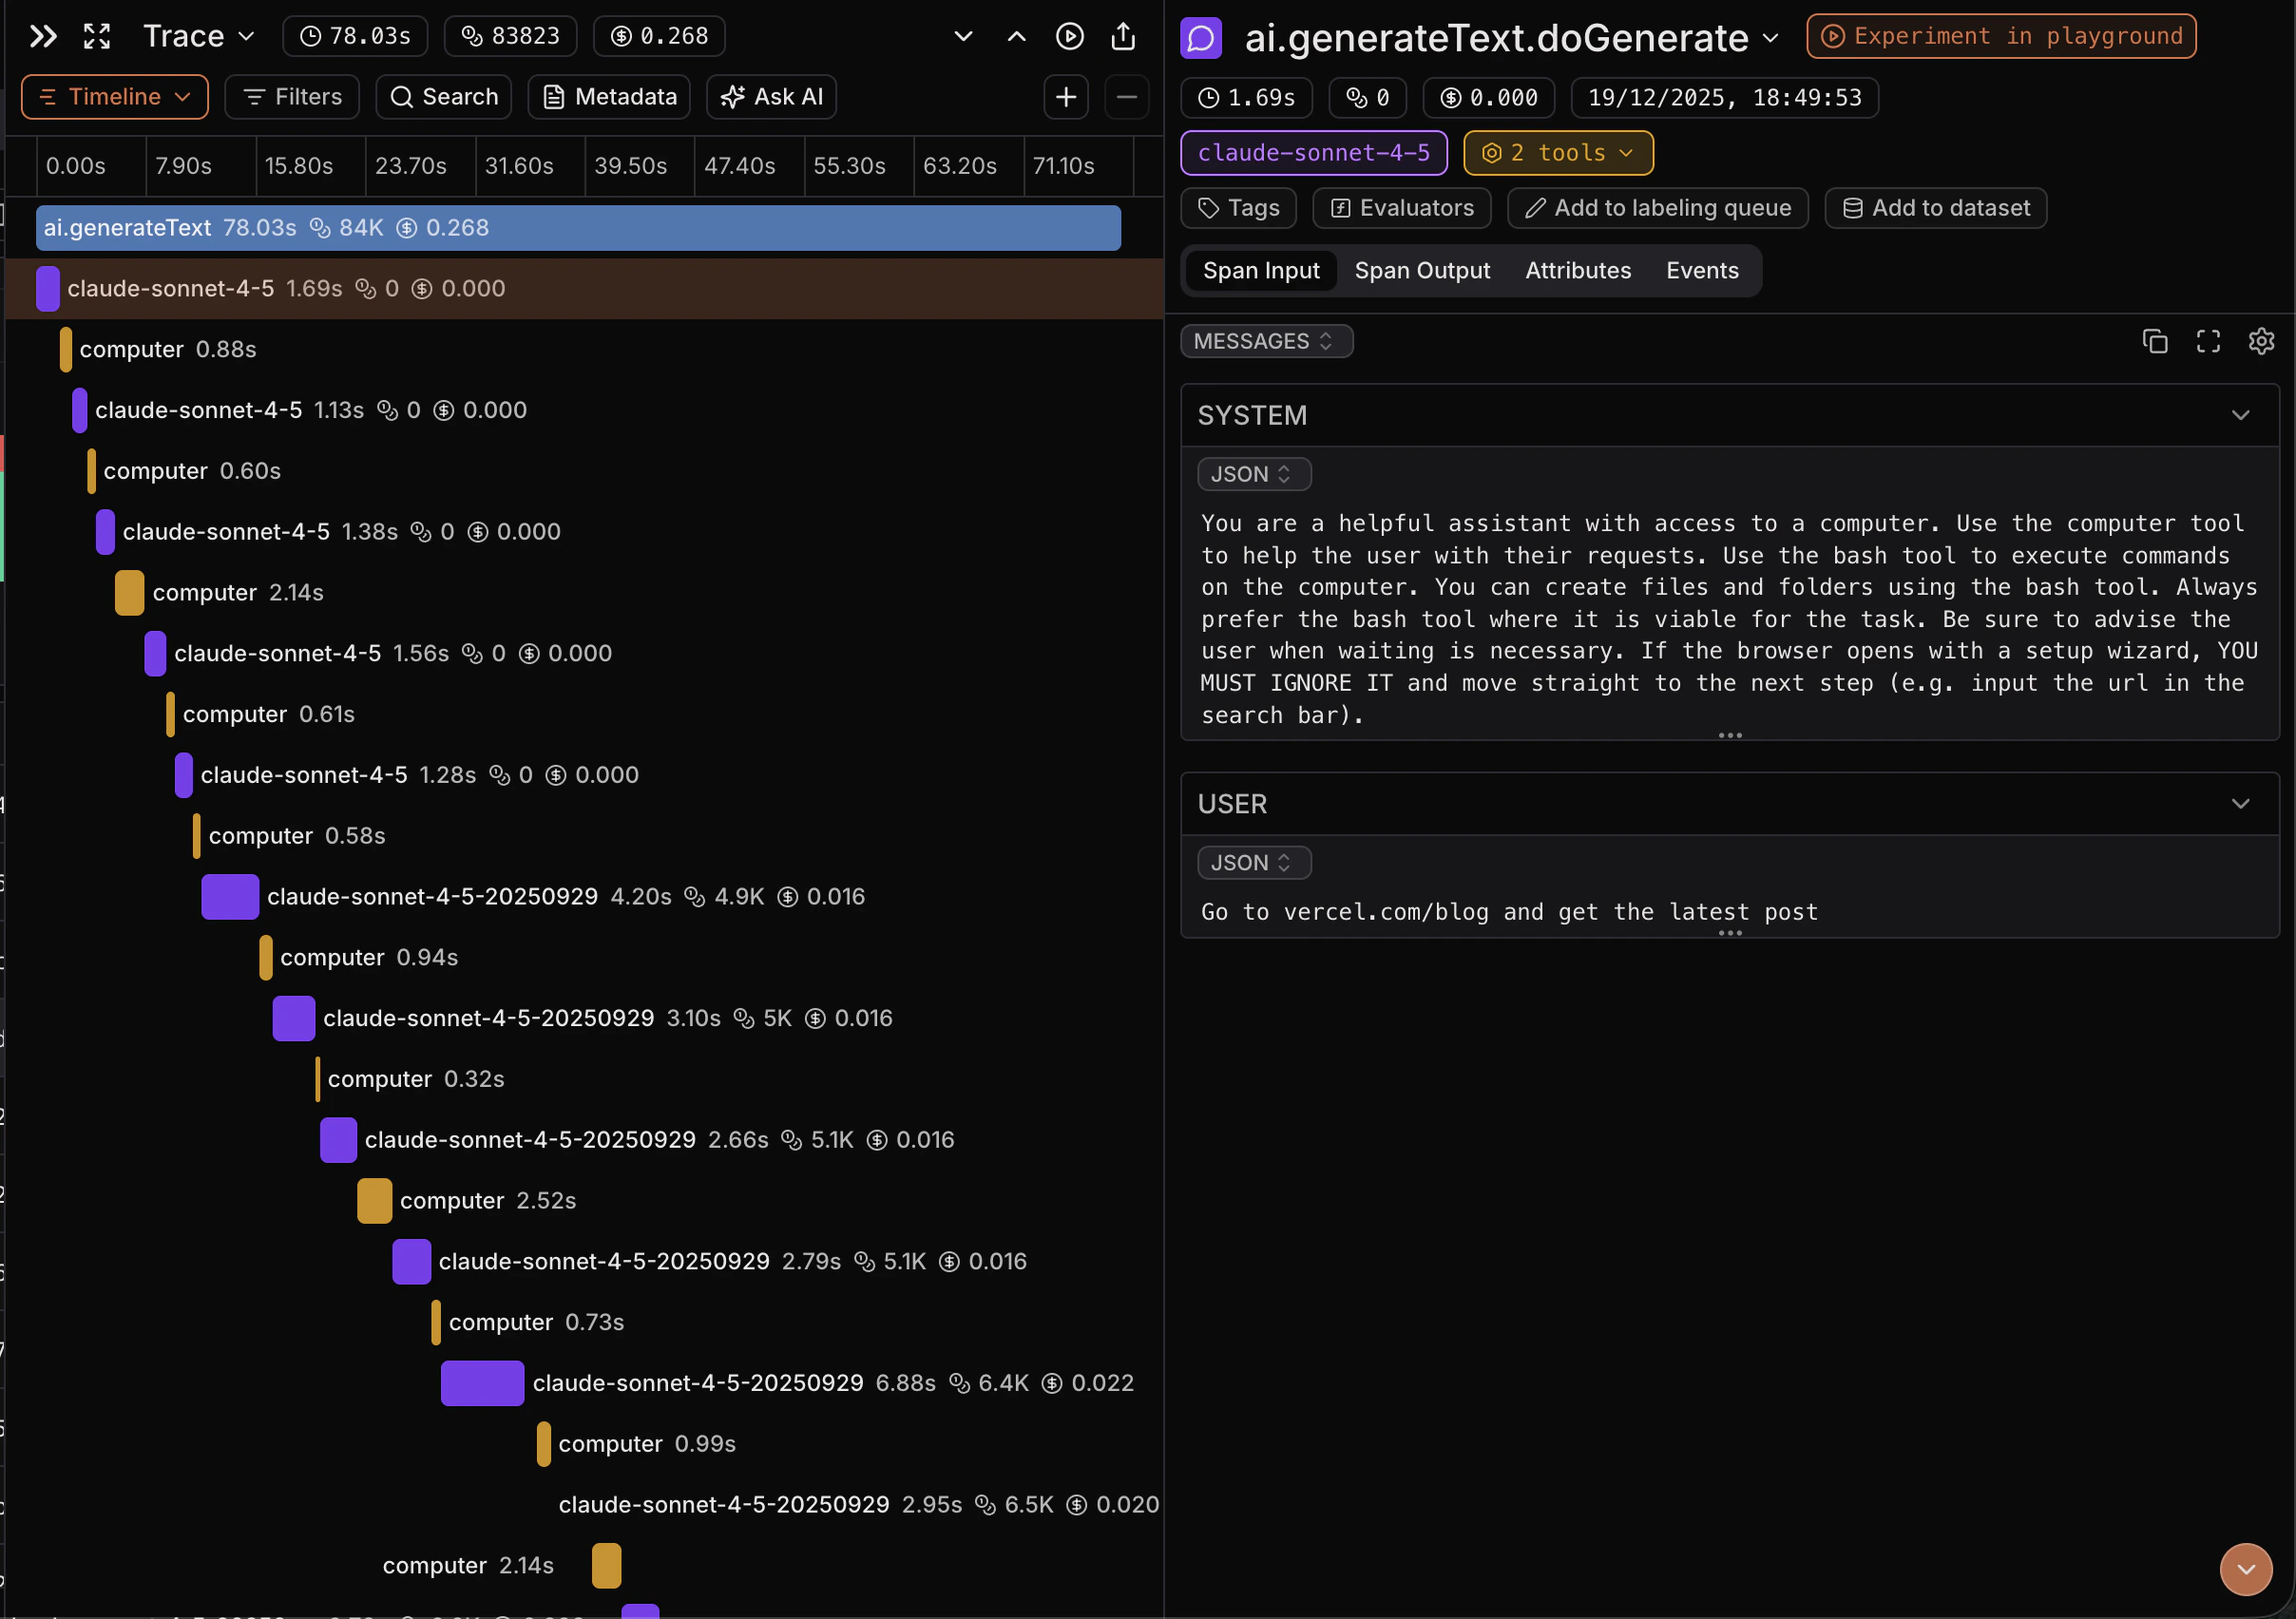 * **Time-first view**: Renders each span as a colored bar on a single time axis.
* **Zoom controls**: Use +/- to zoom in for fine-grained alignment or out for a high-level overview.
* **Event markers**: Span events appear as ticks inside the bar.
* **Inline labels**: Name + duration (and tokens/cost for LLM spans) are shown on the bar when space allows.
Use Timeline View when you’re diagnosing latency, overlaps, gaps, or long-running steps.
## Metadata
### Open Metadata
1. Open a trace (from **Traces**).
2. In the trace view toolbar, click **Metadata**.
* **Time-first view**: Renders each span as a colored bar on a single time axis.
* **Zoom controls**: Use +/- to zoom in for fine-grained alignment or out for a high-level overview.
* **Event markers**: Span events appear as ticks inside the bar.
* **Inline labels**: Name + duration (and tokens/cost for LLM spans) are shown on the bar when space allows.
Use Timeline View when you’re diagnosing latency, overlaps, gaps, or long-running steps.
## Metadata
### Open Metadata
1. Open a trace (from **Traces**).
2. In the trace view toolbar, click **Metadata**.
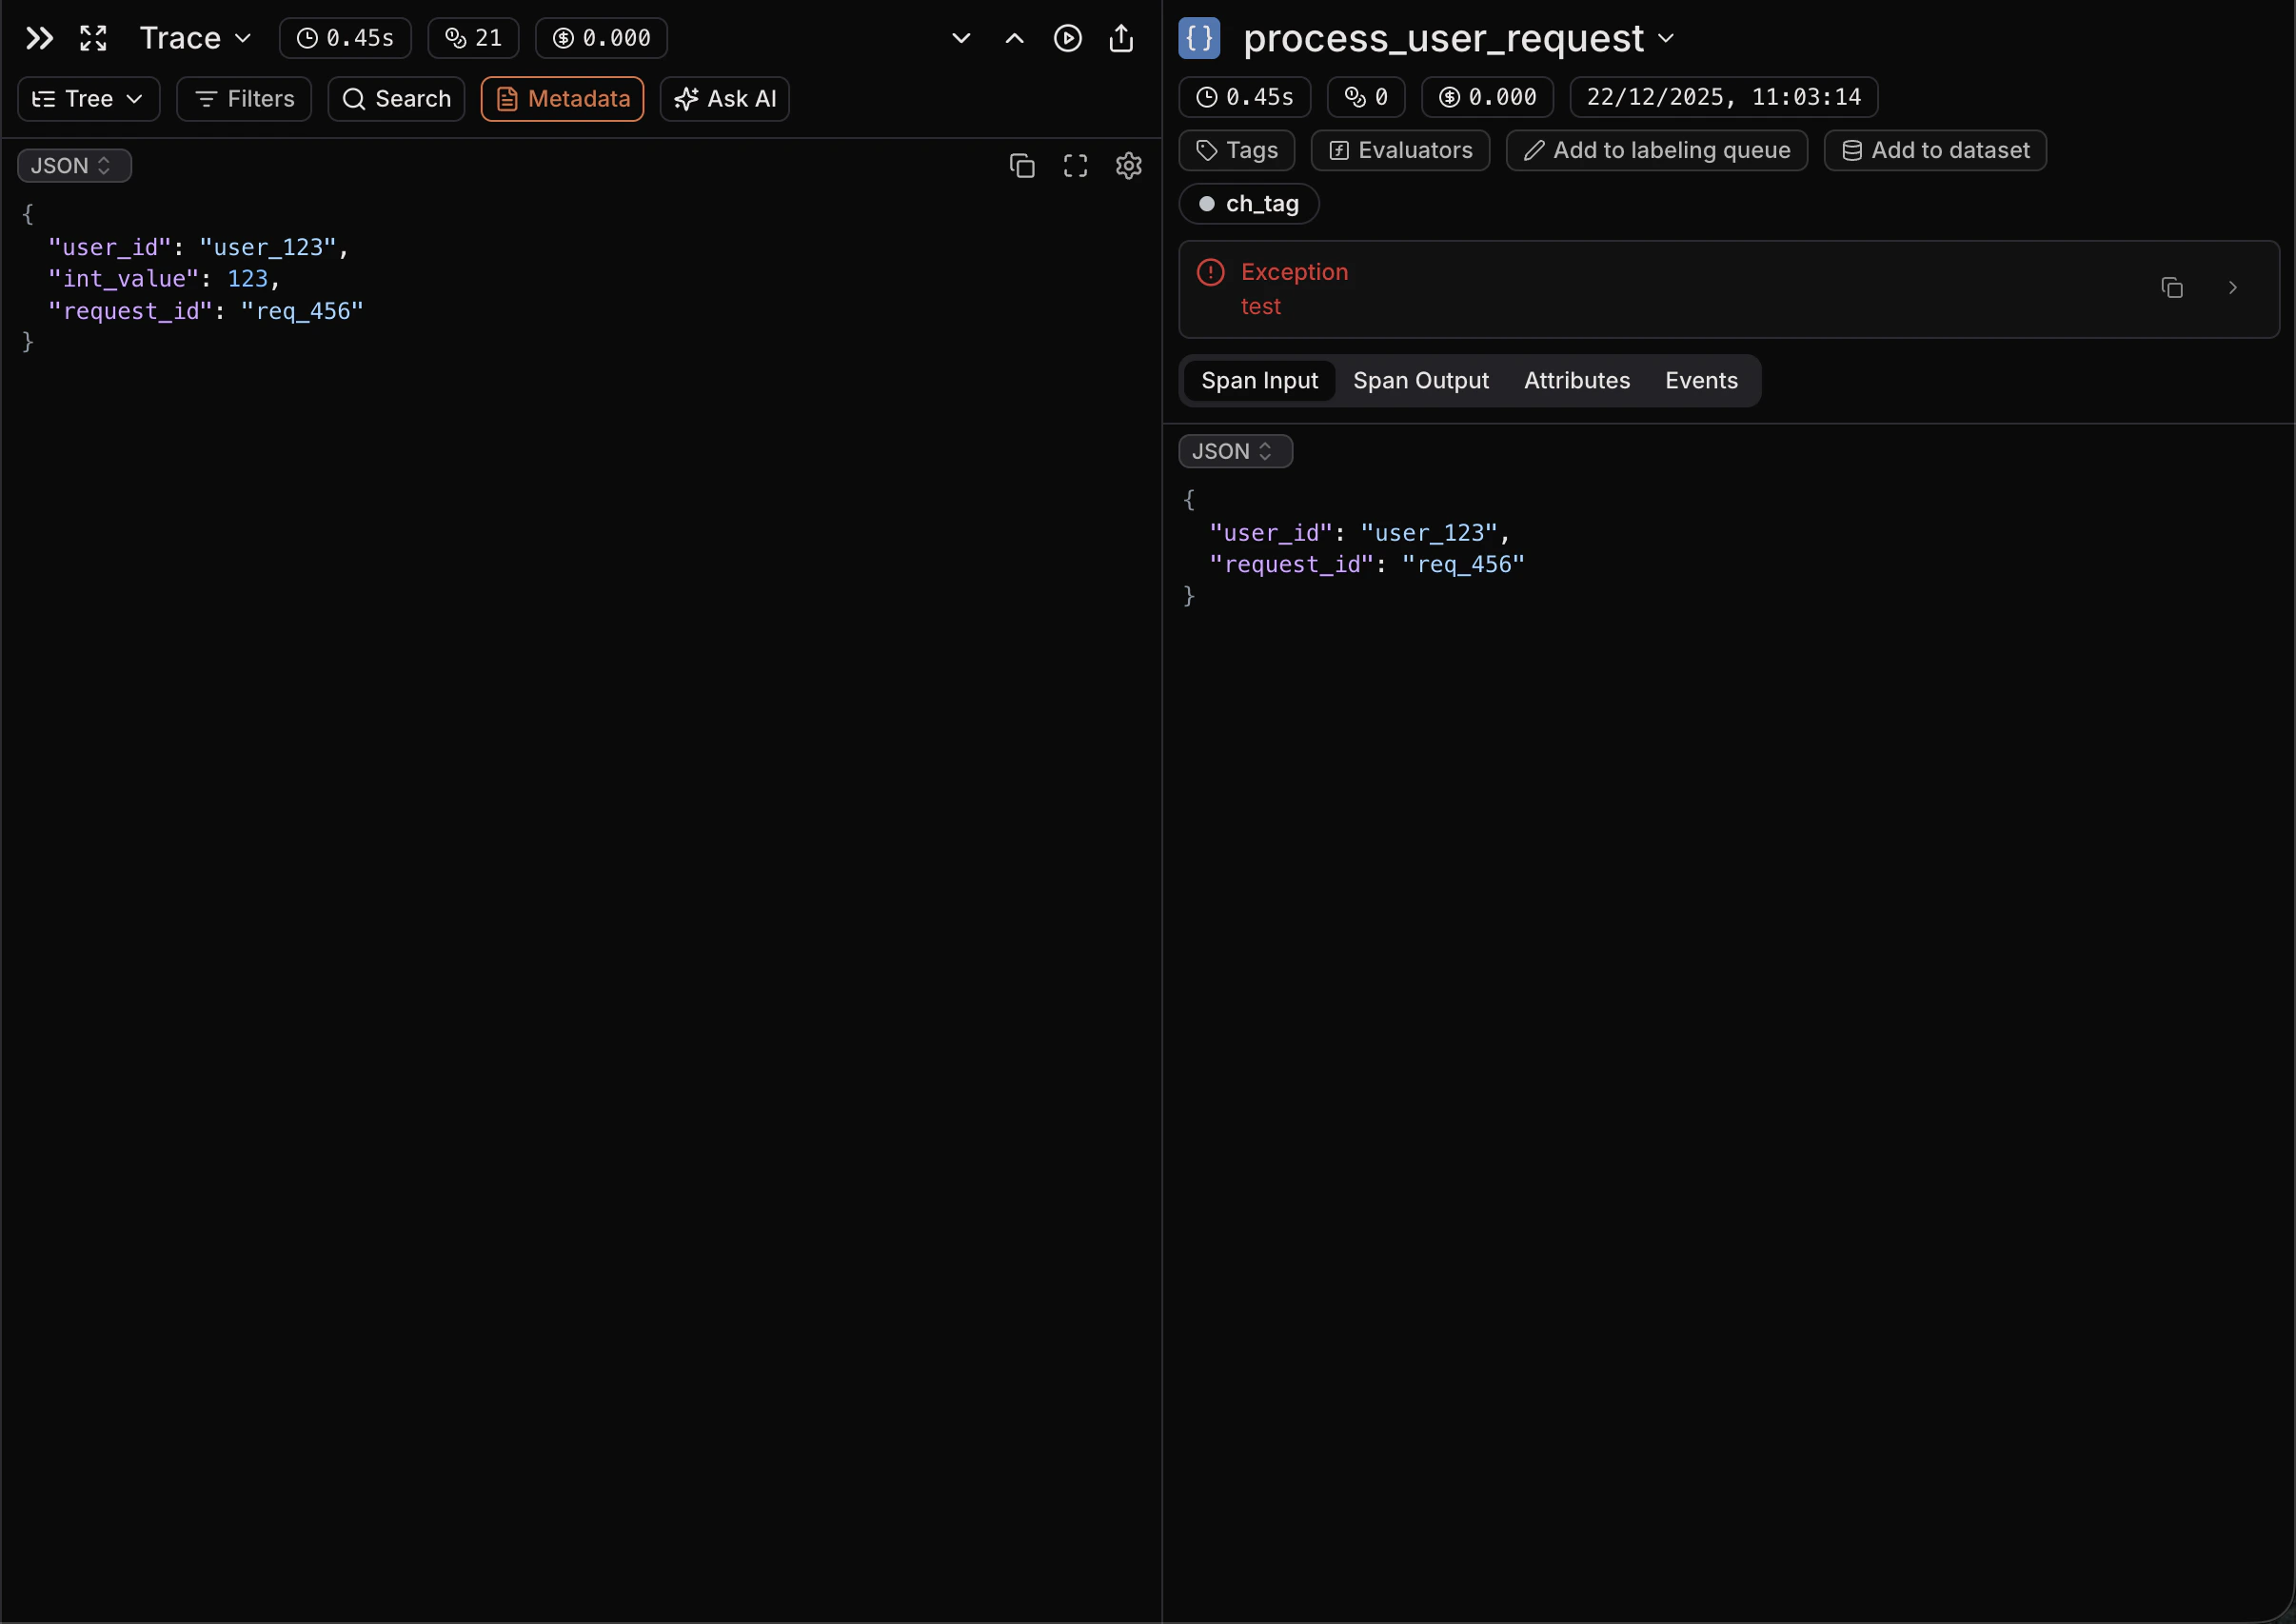 * **Read-only source of truth**: Shows the trace metadata exactly as stored.
* **JSON-first**: Defaults to a JSON view with formatting and syntax highlighting.
* **Search/copy friendly**: Quickly find keys/values and copy raw text as needed.
Use Metadata when you need to verify context fields (inputs, run config, tags, custom attributes) without digging through spans. See [Metadata](/tracing/structure/metadata).
## Ask AI
### Open Ask AI
1. Open a trace (from **Traces**).
2. In the trace view toolbar, click **Ask AI**.
* **Read-only source of truth**: Shows the trace metadata exactly as stored.
* **JSON-first**: Defaults to a JSON view with formatting and syntax highlighting.
* **Search/copy friendly**: Quickly find keys/values and copy raw text as needed.
Use Metadata when you need to verify context fields (inputs, run config, tags, custom attributes) without digging through spans. See [Metadata](/tracing/structure/metadata).
## Ask AI
### Open Ask AI
1. Open a trace (from **Traces**).
2. In the trace view toolbar, click **Ask AI**.
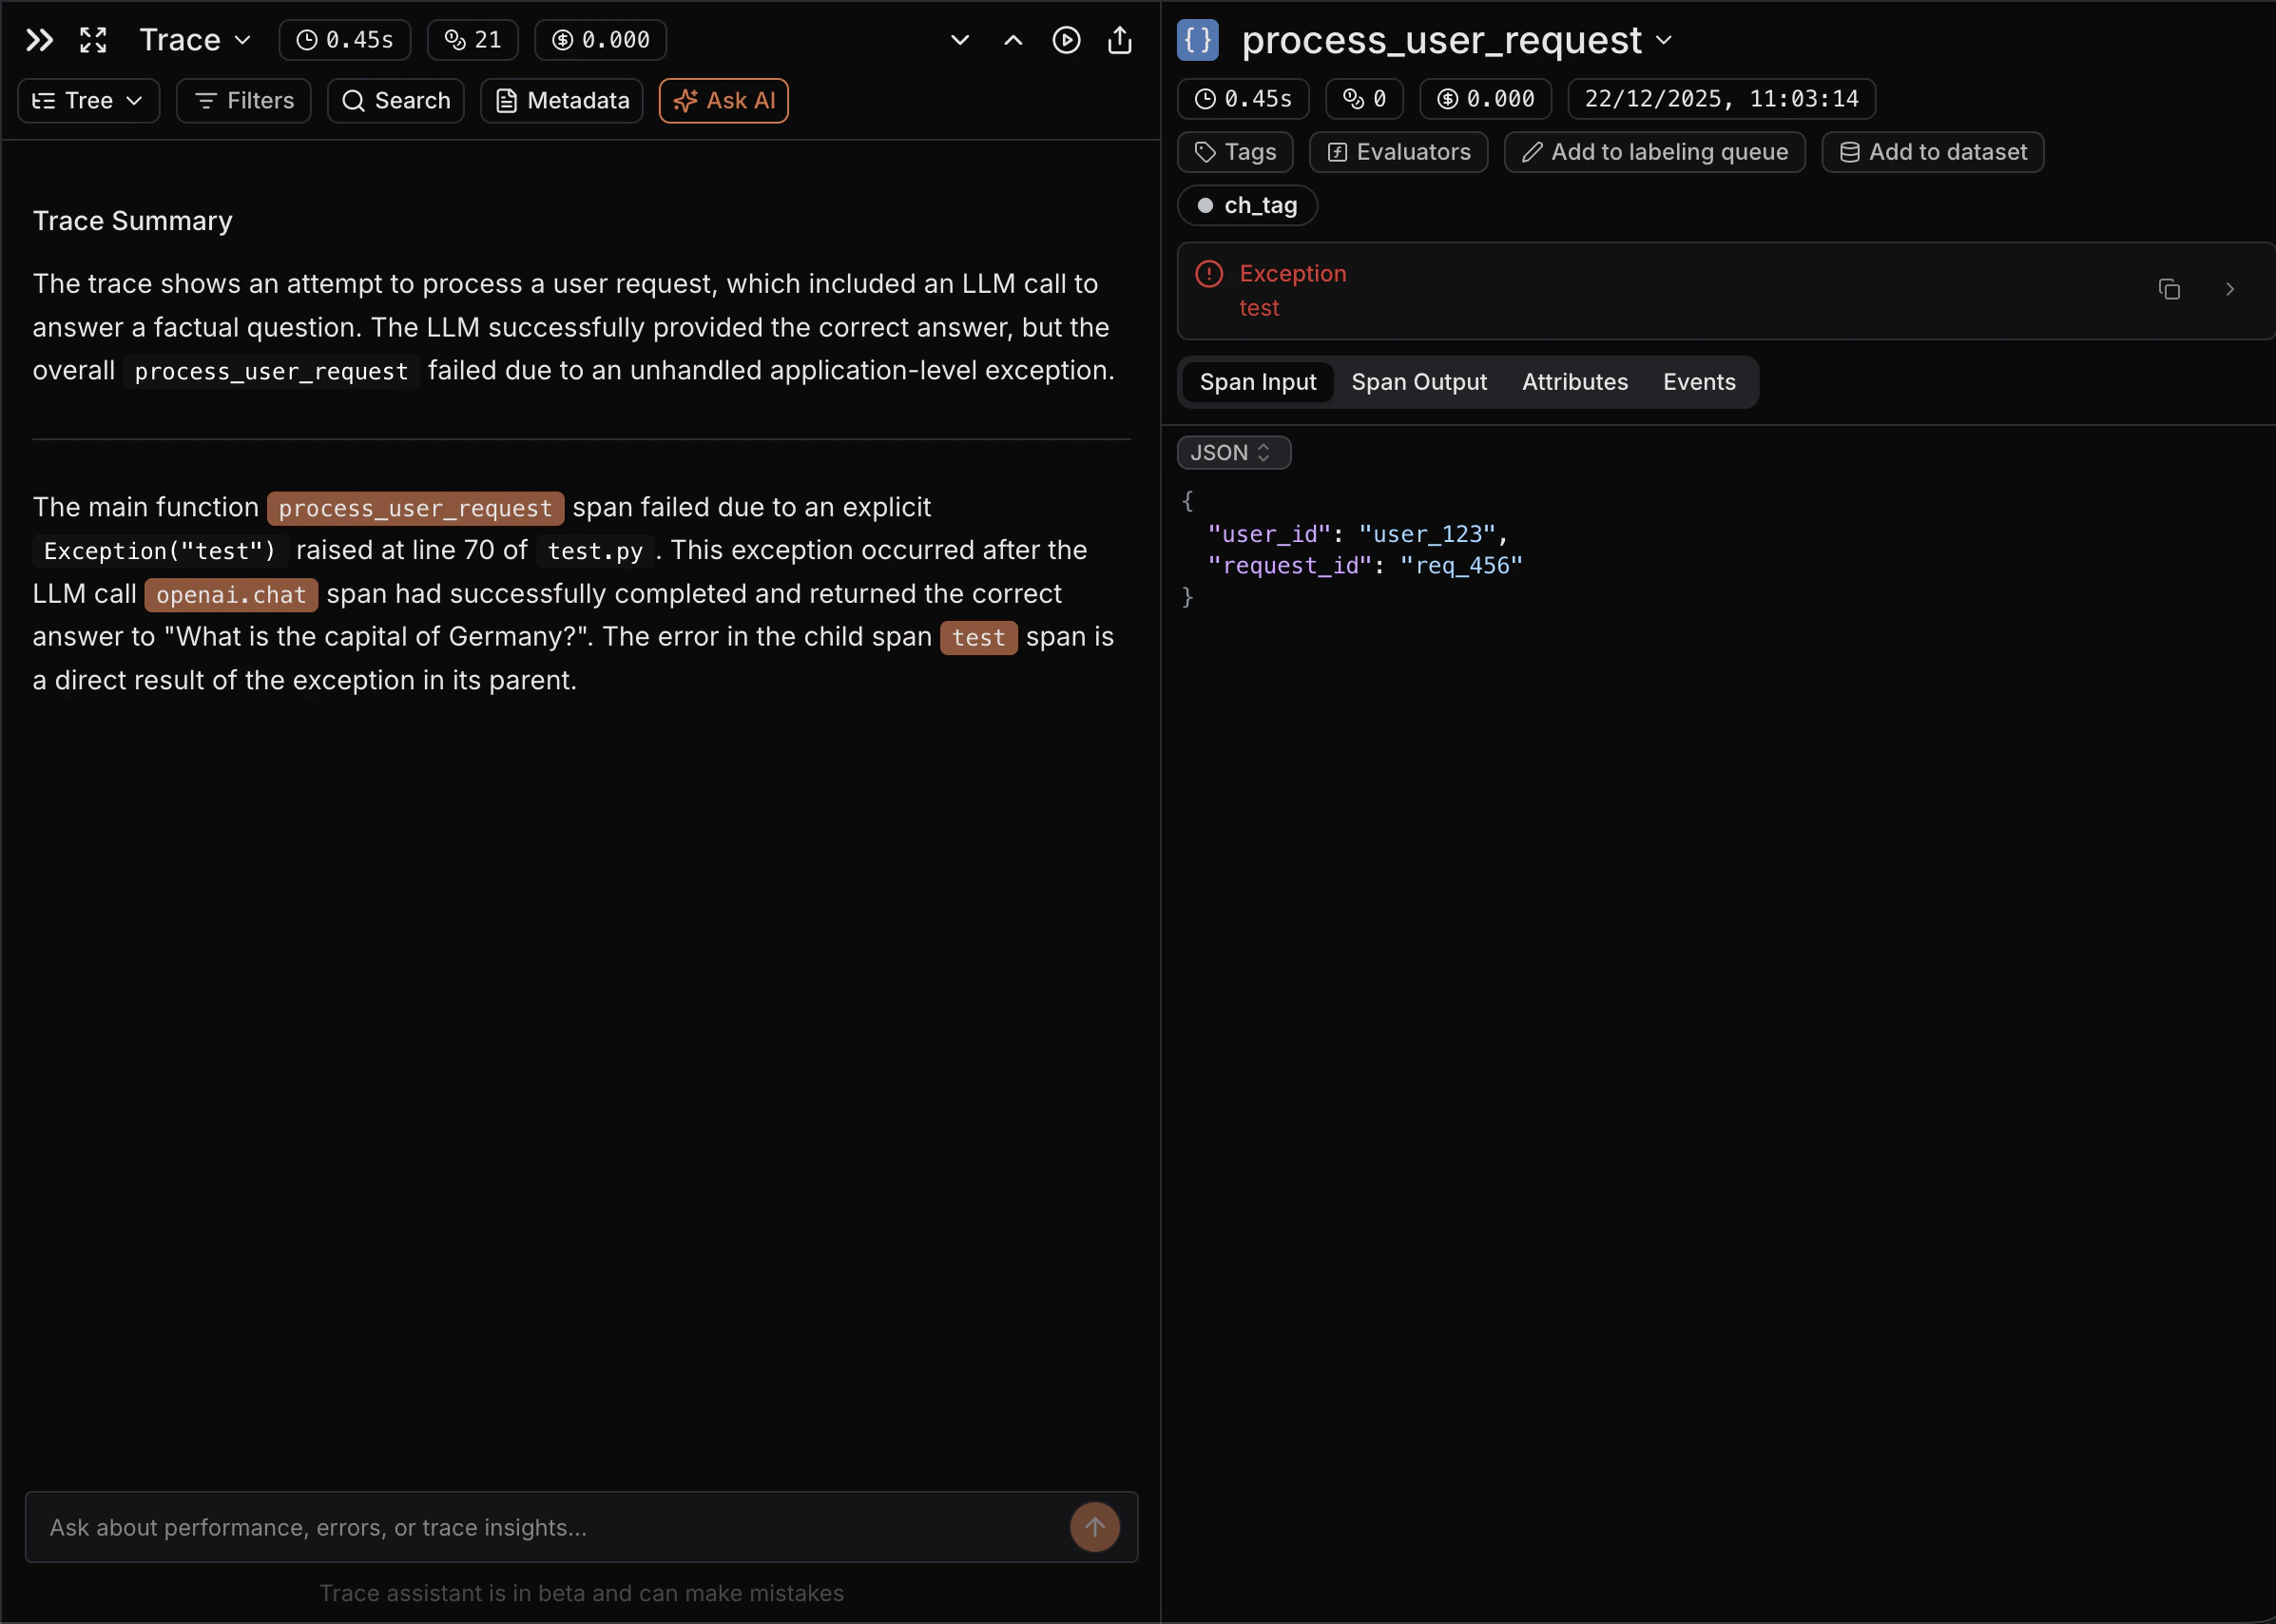 * **Automatic summary**: Generates a trace summary (and deeper analysis) to orient you quickly.
* **Span-aware answers**: When the assistant cites spans, they show up as clickable chips that jump you to the referenced span.
* **Iterate fast**: Ask follow-ups about errors, unexpected outputs, tool calls, or performance.
* **Resettable**: Start a new chat when you want a fresh thread.
Use Ask AI when you want a quick narrative explanation or guided debugging without manually scanning the whole trace.
## Open in SQL Editor
1. Open a trace (from **Traces**).
2. In the trace view header, open the **Trace** dropdown.
3. Select **Open in SQL editor** (opens in a new tab).
* **Pre-filled query (trace)**: Starts with `SELECT * FROM spans WHERE trace_id = ... ORDER BY start_time ASC`.
* **Pre-filled query (span)**: From a span’s detail header dropdown, **Open in SQL editor** creates `SELECT * FROM spans WHERE span_id = ...`.
Use SQL Editor when you need precise filtering, aggregation, or auditing on the raw spans table beyond what the UI exposes. See [SQL Editor](/platform/sql-editor).
* **Automatic summary**: Generates a trace summary (and deeper analysis) to orient you quickly.
* **Span-aware answers**: When the assistant cites spans, they show up as clickable chips that jump you to the referenced span.
* **Iterate fast**: Ask follow-ups about errors, unexpected outputs, tool calls, or performance.
* **Resettable**: Start a new chat when you want a fresh thread.
Use Ask AI when you want a quick narrative explanation or guided debugging without manually scanning the whole trace.
## Open in SQL Editor
1. Open a trace (from **Traces**).
2. In the trace view header, open the **Trace** dropdown.
3. Select **Open in SQL editor** (opens in a new tab).
* **Pre-filled query (trace)**: Starts with `SELECT * FROM spans WHERE trace_id = ... ORDER BY start_time ASC`.
* **Pre-filled query (span)**: From a span’s detail header dropdown, **Open in SQL editor** creates `SELECT * FROM spans WHERE span_id = ...`.
Use SQL Editor when you need precise filtering, aggregation, or auditing on the raw spans table beyond what the UI exposes. See [SQL Editor](/platform/sql-editor).